cppuprofile
This project provides a tiny C++ profiling library for monitoring:
- execution time
- CPU usage
- memory usage
- GPU usage and memory
This library aims at collecting metrics on embedded devices to monitor device performance while operating heavy tasks or booting for example. Those metrics can be useful to check that load is properly spread onto all CPU cores or that memory is not starved.
This library can also run on non-embedded devices like servers or desktop PCs. It is compatible with Linux and Windows.
Metrics are stored in a CSV file (the path is configurable).
Usage
The library is lightweight, simple and easy to use. It can be easily used from an existing application or integrated in a dedicated monitoring application.
Full API documentation is available here.
System memory and CPU usage monitoring
#include <uprofile/uprofile.h>
...
uprofile::start("uprofile.log");
uprofile::startSystemMemoryMonitoring(200);
uprofile::startCPUUsageMonitoring(200);
...
uprofile::stop();
Record time execution
uprofile::timeBegin("my_custom_function");
...
uprofile::timeEnd("my_custom_function");
GPU monitoring
The library also supports GPU metrics monitoring like usage and memory. Since GPU monitoring is specific to each vendor, an interface IGPUMonitor is available to abstract each vendor monitor system.
To monitor a specific GPU, you must subclass IGPUMonitor:
#include <uprofile/igpumonitor.h>

class MyGPUMonitor: public uprofile::IGPUMonitor {
public:
    float getUsage() override;
    void getMemory(int& usedMem, int& totalMem) override;
}
And then inject it at runtime to the uprofile monitoring system:
uprofile::addGPUMonitor(new MyGPUMonitor);
uprofile::start("uprofile.log");
uprofile::startGPUMemoryMonitoring(200);
uprofile::startGPUUsageMonitoring(200);
Supported GPU monitoring
Here is the list of GPUs supported by cppuprofile
- NVidia Graphics Cards (through
nvidia-smi). Pass-DGPU_MONITOR_NVIDIA=ONas compile option and injectuprofile::NvidiaMonitorfrommonitors/nvidiamonitor.hasGPUMonitor. Thenvidia-smitool should be installed into/usr/bindirectory.
Build
The build process is based on CMake. Minimum version is 2.8.
$ cmake --configure . -B ../build-cppuprofile
$ cmake --build ../build-cppuprofile
Shared/dynamic library
By default, it generates a shared library on Linux and a dynamic library (DLL) on Windows. To link with this library on Windows, you must
pass -DUPROFILE_DLL definition to CMake.
Static library
If you want to generate a static library, you must use -DBUILD_SHARED_LIBS=OFF CMake option.
Disable profiling in Release mode
If you want to disable profiling in Release mode or if you want to only enable profiling in particular cases, you can use the PROFILE_ENABLED option (set to ON by default).
To disable the profiling:
$ cmake --configure . -B ../build-cppuprofile -DPROFILE_ENABLED=OFF
Tools
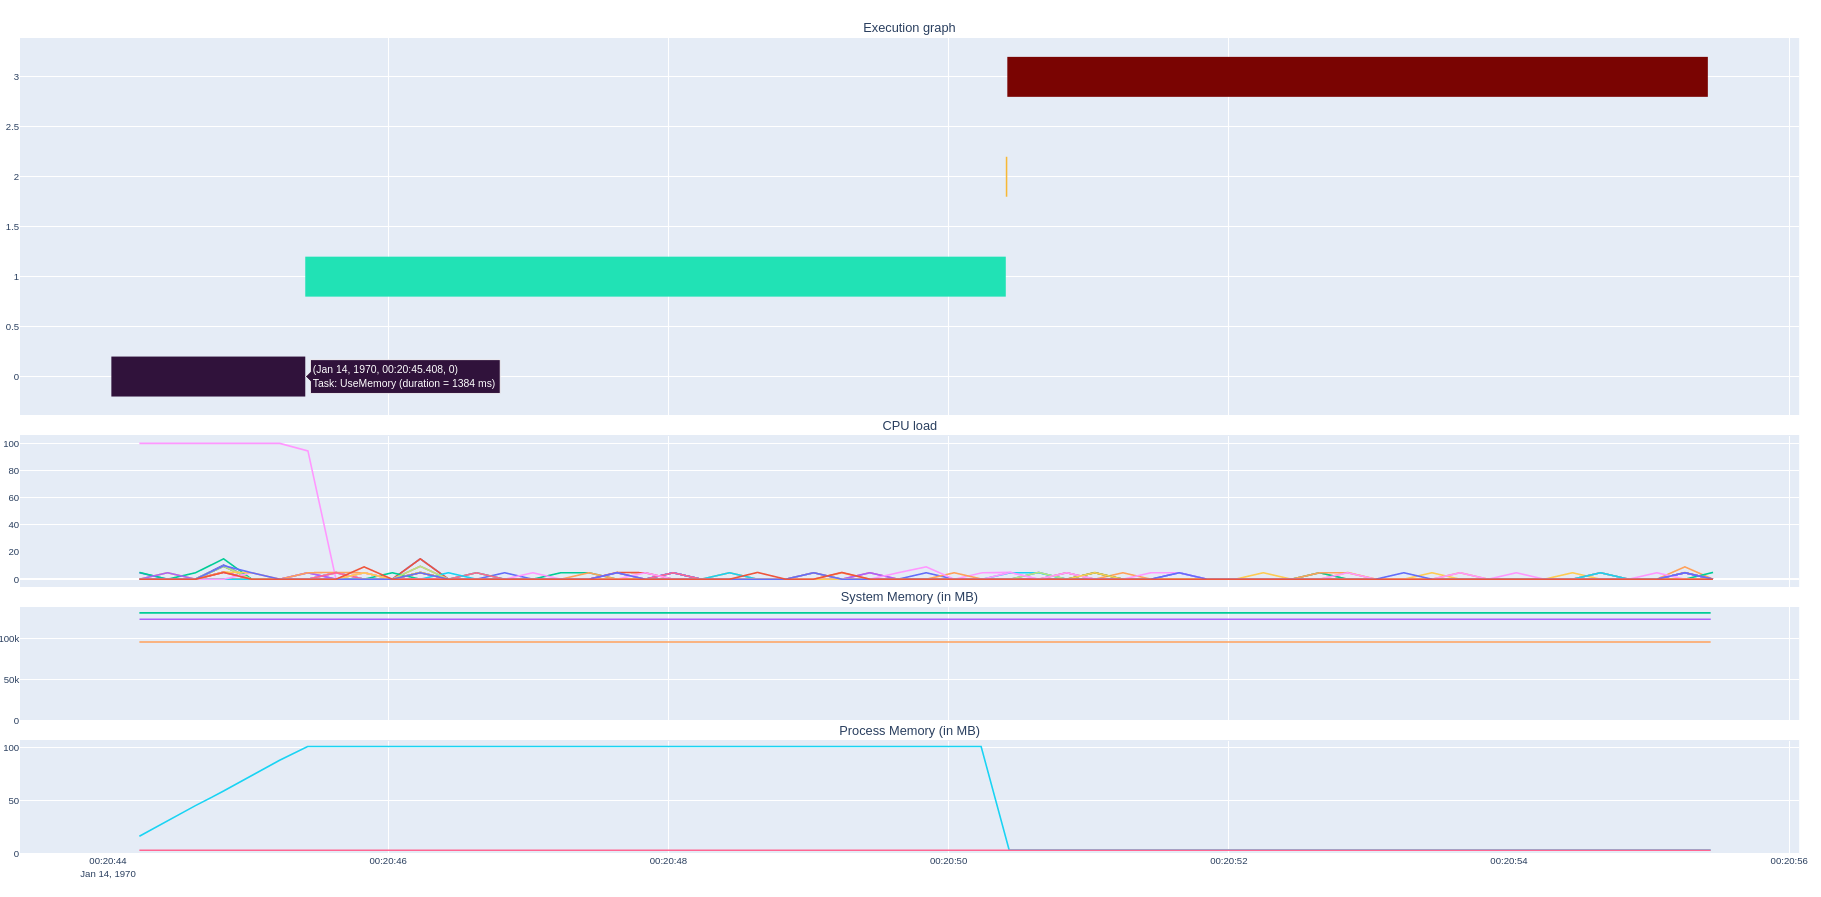
The project also brings a tool for displaying the different metrics in a single view:
This tool is written in Python3. It requires a set of dependency packages. To install them:
$ pip3 install -r requirements.txt
Then
$ ./tools/show-graph uprofile.log
Note that you can filter the metrics to display with --metric argument.
Sample
The project provides a C++ sample application called uprof-sample
that shows how to use the cppuprofile library. You can build it with SAMPLE_ENABLED option:
$ cmake --configure . -B ../build-cppuprofile -DSAMPLE_ENABLED=ON
$ cmake --build ../build-cppuprofile
$ ../build-cppuprofile/sample/uprof-sample
Windows support limitations
The library compiles on Windows but only time execution is supported so far. Monitoring metrics like CPU Usage and system, process and nvidia GPU memory are not supported.
Contributions are welcomed.
License
This project is licensed under BSD-3-Clause license. See LICENSE file for any further information.


